OpenIM 关于 管理后台 和 监控 的部署和设计
OpenIM 提供了多种灵活的部署选项,适用于不同的环境和需求。以下是这些部署方案的简化和优化描述:
- 源码部署:
- 集群部署:
- Kubernetes 部署:提供两种方式,包括通过 helm 和 sealos 进行部署。这适用于需要高可用性和可扩展性的环境。具体方法请参考:Kubernetes 部署指南。
- Docker 部署:
- 普通 Docker 方式:适用于快速部署和小型项目。详细信息请见:Docker 部署指南。
- Docker Compose 方式:提供了更便捷的服务管理和配置,适合于复杂的多容器应用。
接下来,我们将逐一介绍这些部署方法的具体步骤、监控和管理后台的配置,以及使用技巧,帮助您根据自己的需求选择最合适的部署方案。
源码 & Docker
部署
源码部署 openim-server 和 openim-chat ,其他的组件都是通过 Docker 部署。
docker 部署则通过 https://github.com/openimsdk/openim-docker 仓库一键部署所有的组件。
部署的配置文件,可以阅读 https://github.com/openimsdk/open-im-server/blob/main/scripts/install/environment.sh 文档了解如何学习以及熟悉各个环境变量。
对于 Prometheus 来说,默认是没有开启 Prometheus 的,如果需要开启的话,需要在 make init 之前设置环境变量:
export PROMETHEUS_ENABLE=true # 默认是 false
然后执行:
make init
docker compose up -d
配置
要在 Grafana 中配置 Prometheus 数据源,请遵循以下步骤:
登录 Grafana: 首先,打开浏览器并访问 Grafana 的网址。如果您未更改端口,则地址通常为 http://localhost:3000
使用默认凭据登录: Grafana 的默认用户名和密码都是
admin。首次登录时,系统将提示您更改密码。进入数据源设置(DATA SOURCES):
- 在 Grafana 的左侧菜单中,寻找并点击“齿轮”图标,代表“配置”。
- 在配置菜单中,选择“数据源”。
添加新的数据源:
- 在数据源页面,点击“添加数据源”按钮。
- 在列表中找到并选择“Prometheus”。
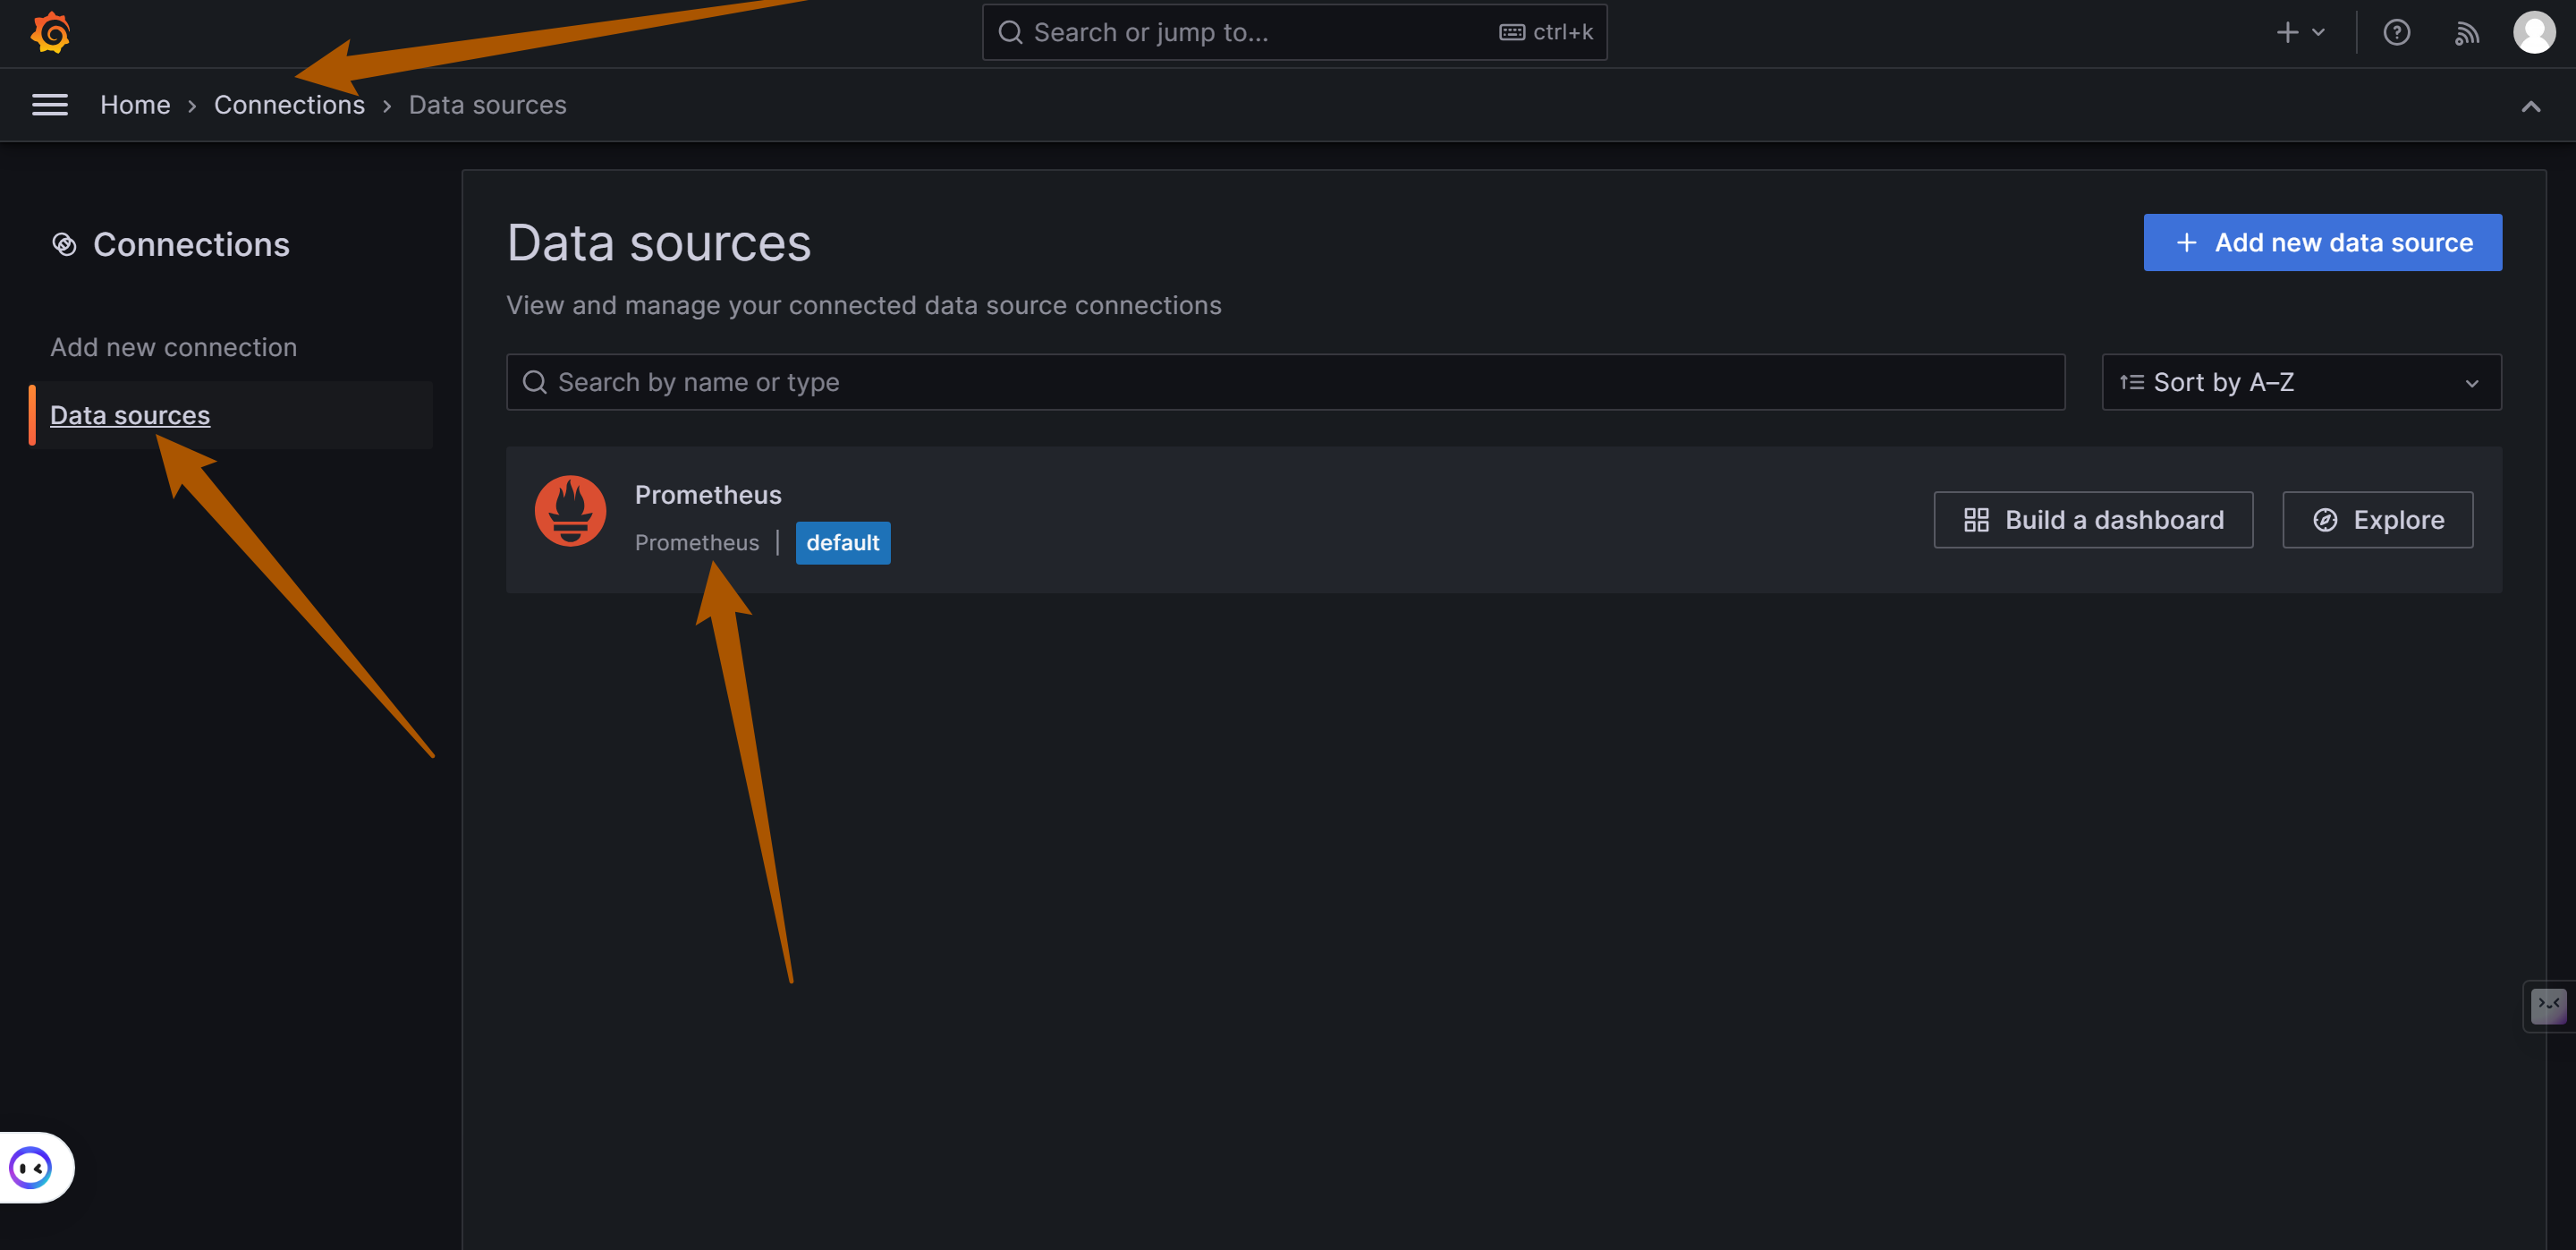
点击
Add New connection可以添加更多的数据源,比如说 Loki (负责日志存储和处理查询)配置 Prometheus 数据源:
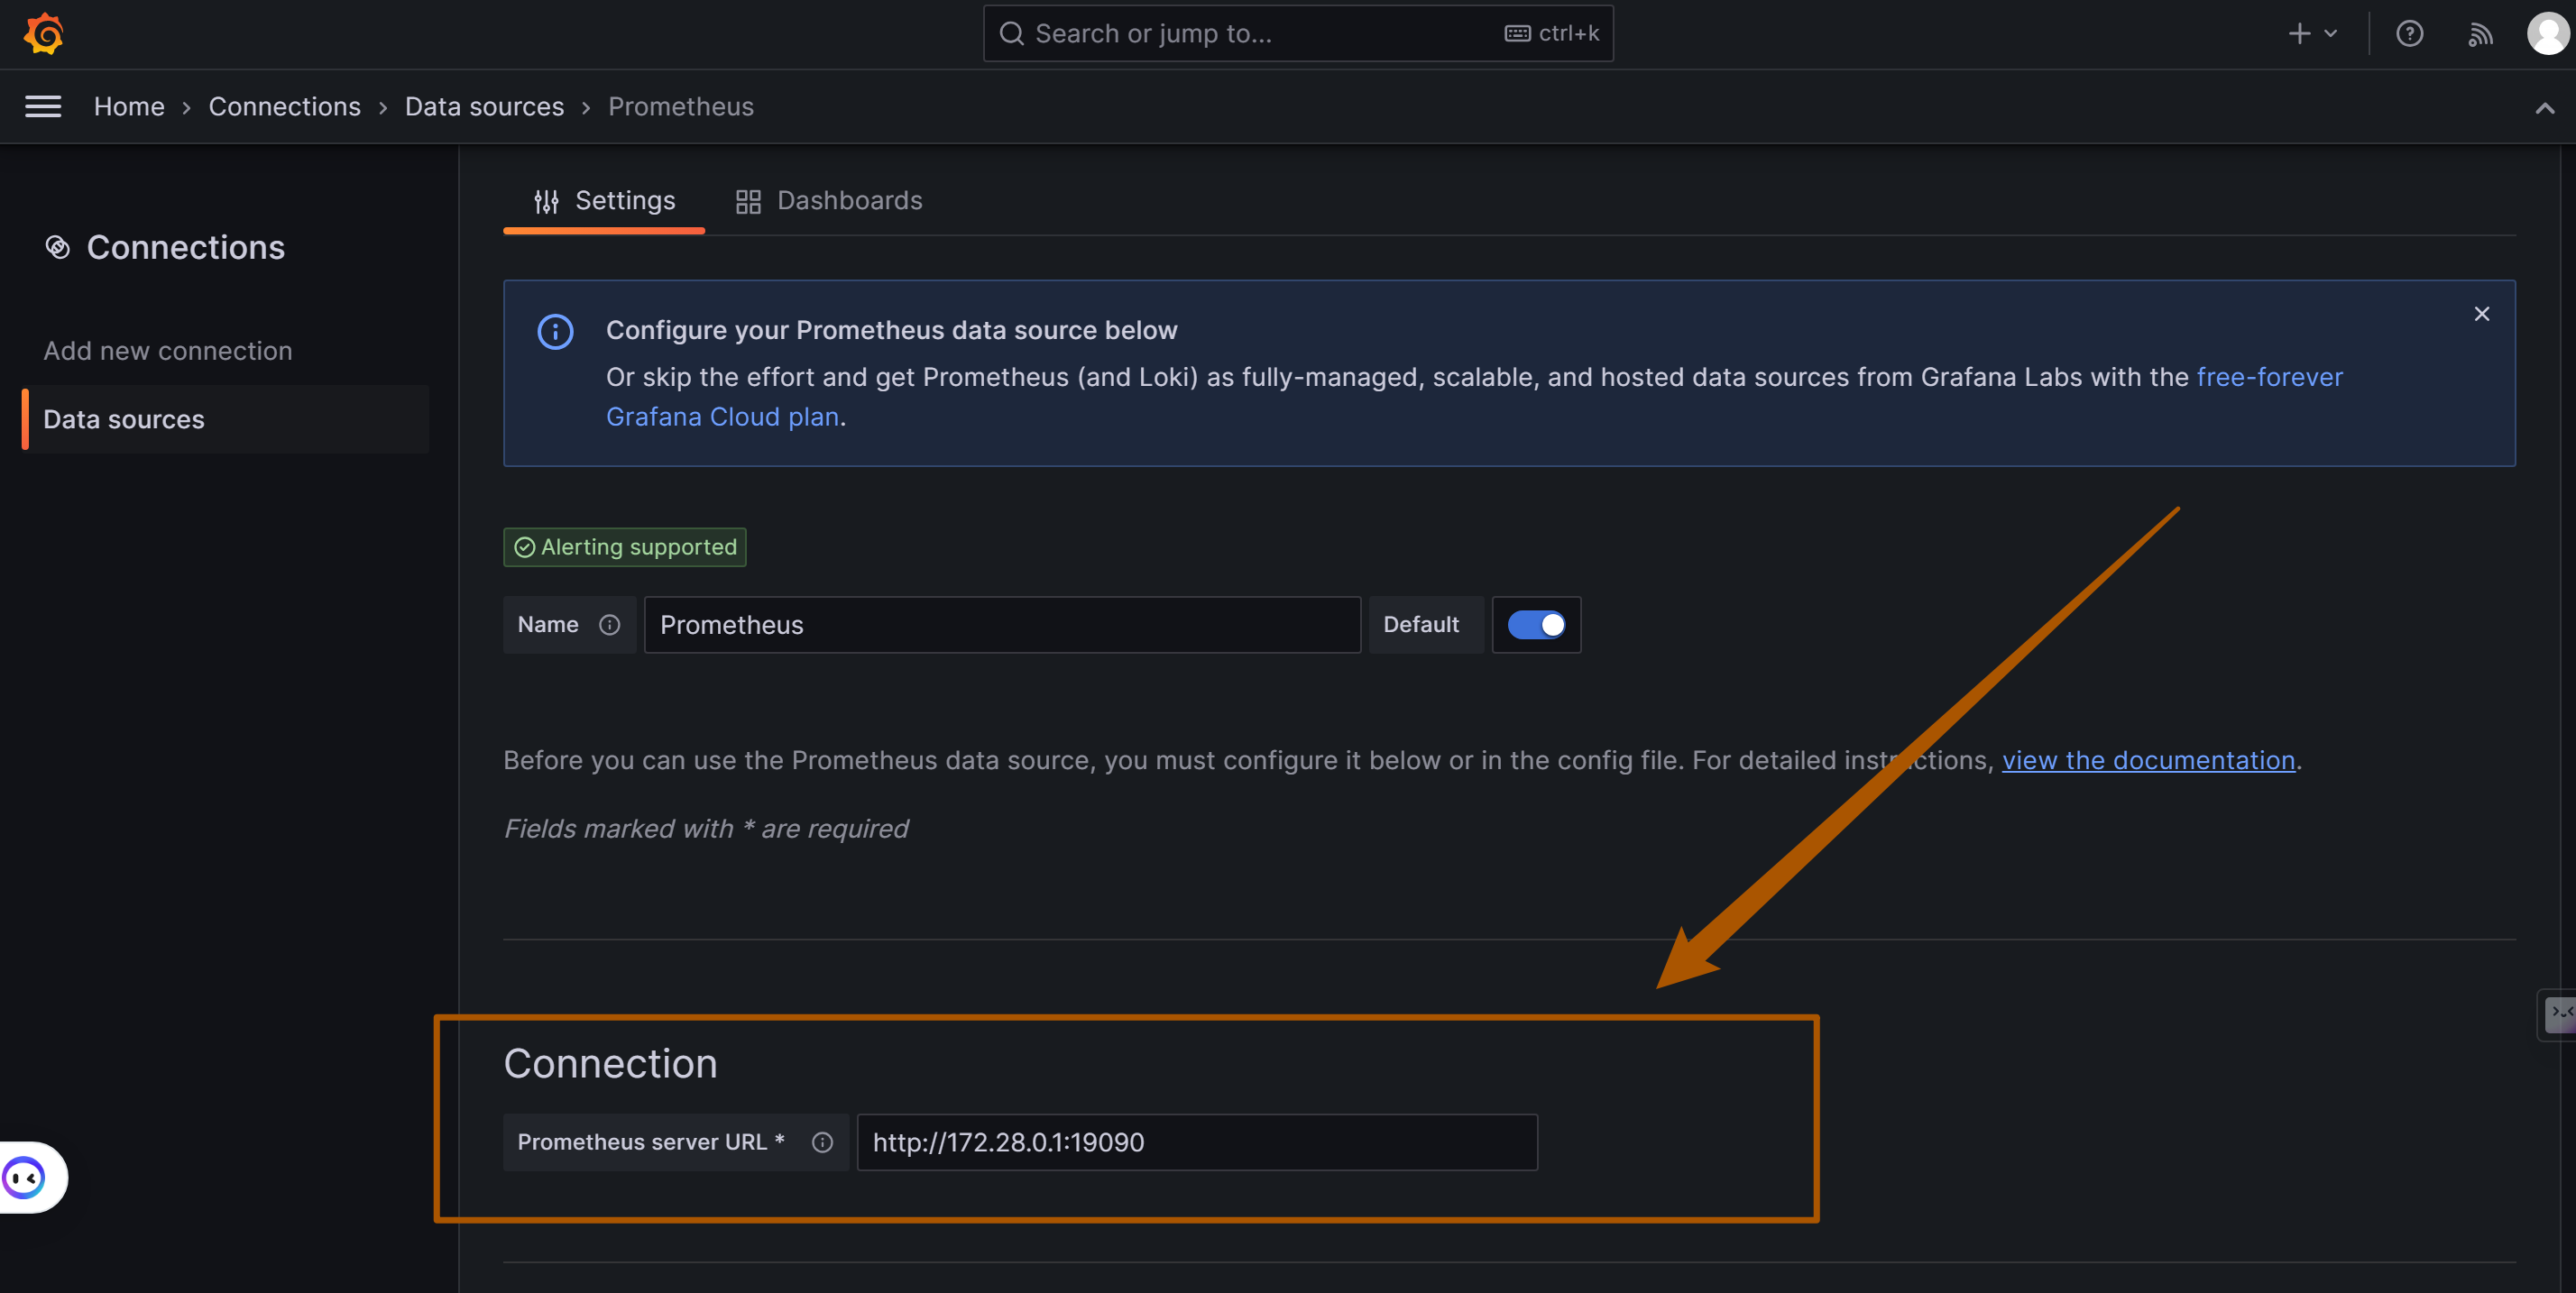
在配置页面,填写 Prometheus 服务器的详细信息。这通常包括 Prometheus 服务的 URL(例如 OpenIM 默认部署的是
http://172.28.0.1:19090,如果 Prometheus 在同一台机器上运行)。地址是和 和
cat .env| grep DOCKER_BRIDGE_GATEWAY变量地址一致。OpenIM 和 组件之间通过 getway 链接的。端口 OpenIM 默认使用的19090根据需要调整其他设置,例如认证、TLS 设置等。
保存并测试:
- 完成配置后,点击“保存&测试”按钮以确保 Grafana 能够成功连接到 Prometheus。
Grafana 中的 Dashboard 导入指南
导入 Grafana Dashboard 是一个简洁的过程,适用于 OpenIM Server 应用服务和 Node Exporter。以下是详细步骤和必要的注意事项:
关键指标概览与部署步骤
在 Grafana 中监控 OpenIM,您需要关注以下三类关键指标,每个类别都有其特定的部署和配置步骤:
- OpenIM 指标 (
prometheus-dashboard.yaml):- 配置文件路径:在
config/prometheus-dashboard.yaml。 - 启用监控:设置环境变量
export PROMETHEUS_ENABLE=true以启用 Prometheus 监控。 - 更多信息:查看 OpenIM 配置指南。
- 配置文件路径:在
- Node Exporter:
- 部署容器:部署
quay.io/prometheus/node-exporter容器实现节点监控。 - 获取 Dashboard:访问 Node Exporter 全功能 Dashboard,可以通过下载 YAML 文件或使用 ID 导入。
- 部署指南:参阅 Node Exporter 部署文档。
- 部署容器:部署
- 中间件指标: 每种中间件都需要特定的步骤和配置以实现监控。以下是常见中间件的列表及其相关操作指南链接:
- MySQL:
- 配置:确保 MySQL 开启了性能监控。
- 链接:查看 MySQL 监控配置指南。
- Redis:
- 配置:配置 Redis 以允许监控数据导出。
- 链接:参考 Redis 监控指南。
- MongoDB:
- 配置:设置 MongoDB 的监控指标。
- 链接:查看 MongoDB 监控指南。
- Kafka:
- 配置:整合 Kafka 与 Prometheus 监控。
- 链接:参考 Kafka 监控指南。
- Zookeeper:
- 配置:确保 Zookeeper 可以被 Prometheus 监控。
- 链接:查看 Zookeeper 监控配置。
- MySQL:
导入步骤:
访问 Dashboard 导入界面:
- 在 Grafana 的左侧菜单或右上角点击
+图标,选择“创建”。 - 选择“导入”(Import dashboard)。
- 在 Grafana 的左侧菜单或右上角点击
进行 Dashboard 导入:
- 通过文件上传:直接上传您的 YAML 文件。
- 通过粘贴内容:打开 YAML 文件,复制内容,然后粘贴到导入界面。
- 通过 Grafana.com Dashboard:访问 Grafana Dashboards,搜索并通过 ID 导入所需 Dashboard。
Json model 也可以是你自定义的 Dashboard,需要对自己的业务进行调整,然后配置出来的,在 Dashboard 设置页面中,你可以找到一个 "JSON Model" 或 "Export"(导出)选项。点击这个选项将会显示 Dashboard 的 JSON 配置。你可以复制这个 JSON 配置以便后续导入。
配置 Dashboard:
- 选择适当的数据源,例如之前设置的 Prometheus。
- 调整其他设置,如 Dashboard 名称或存放文件夹。
保存并查看 Dashboard:
- 完成配置后,点击“导入”以完成操作。
- 导入成功后立即查看新 Dashboard。
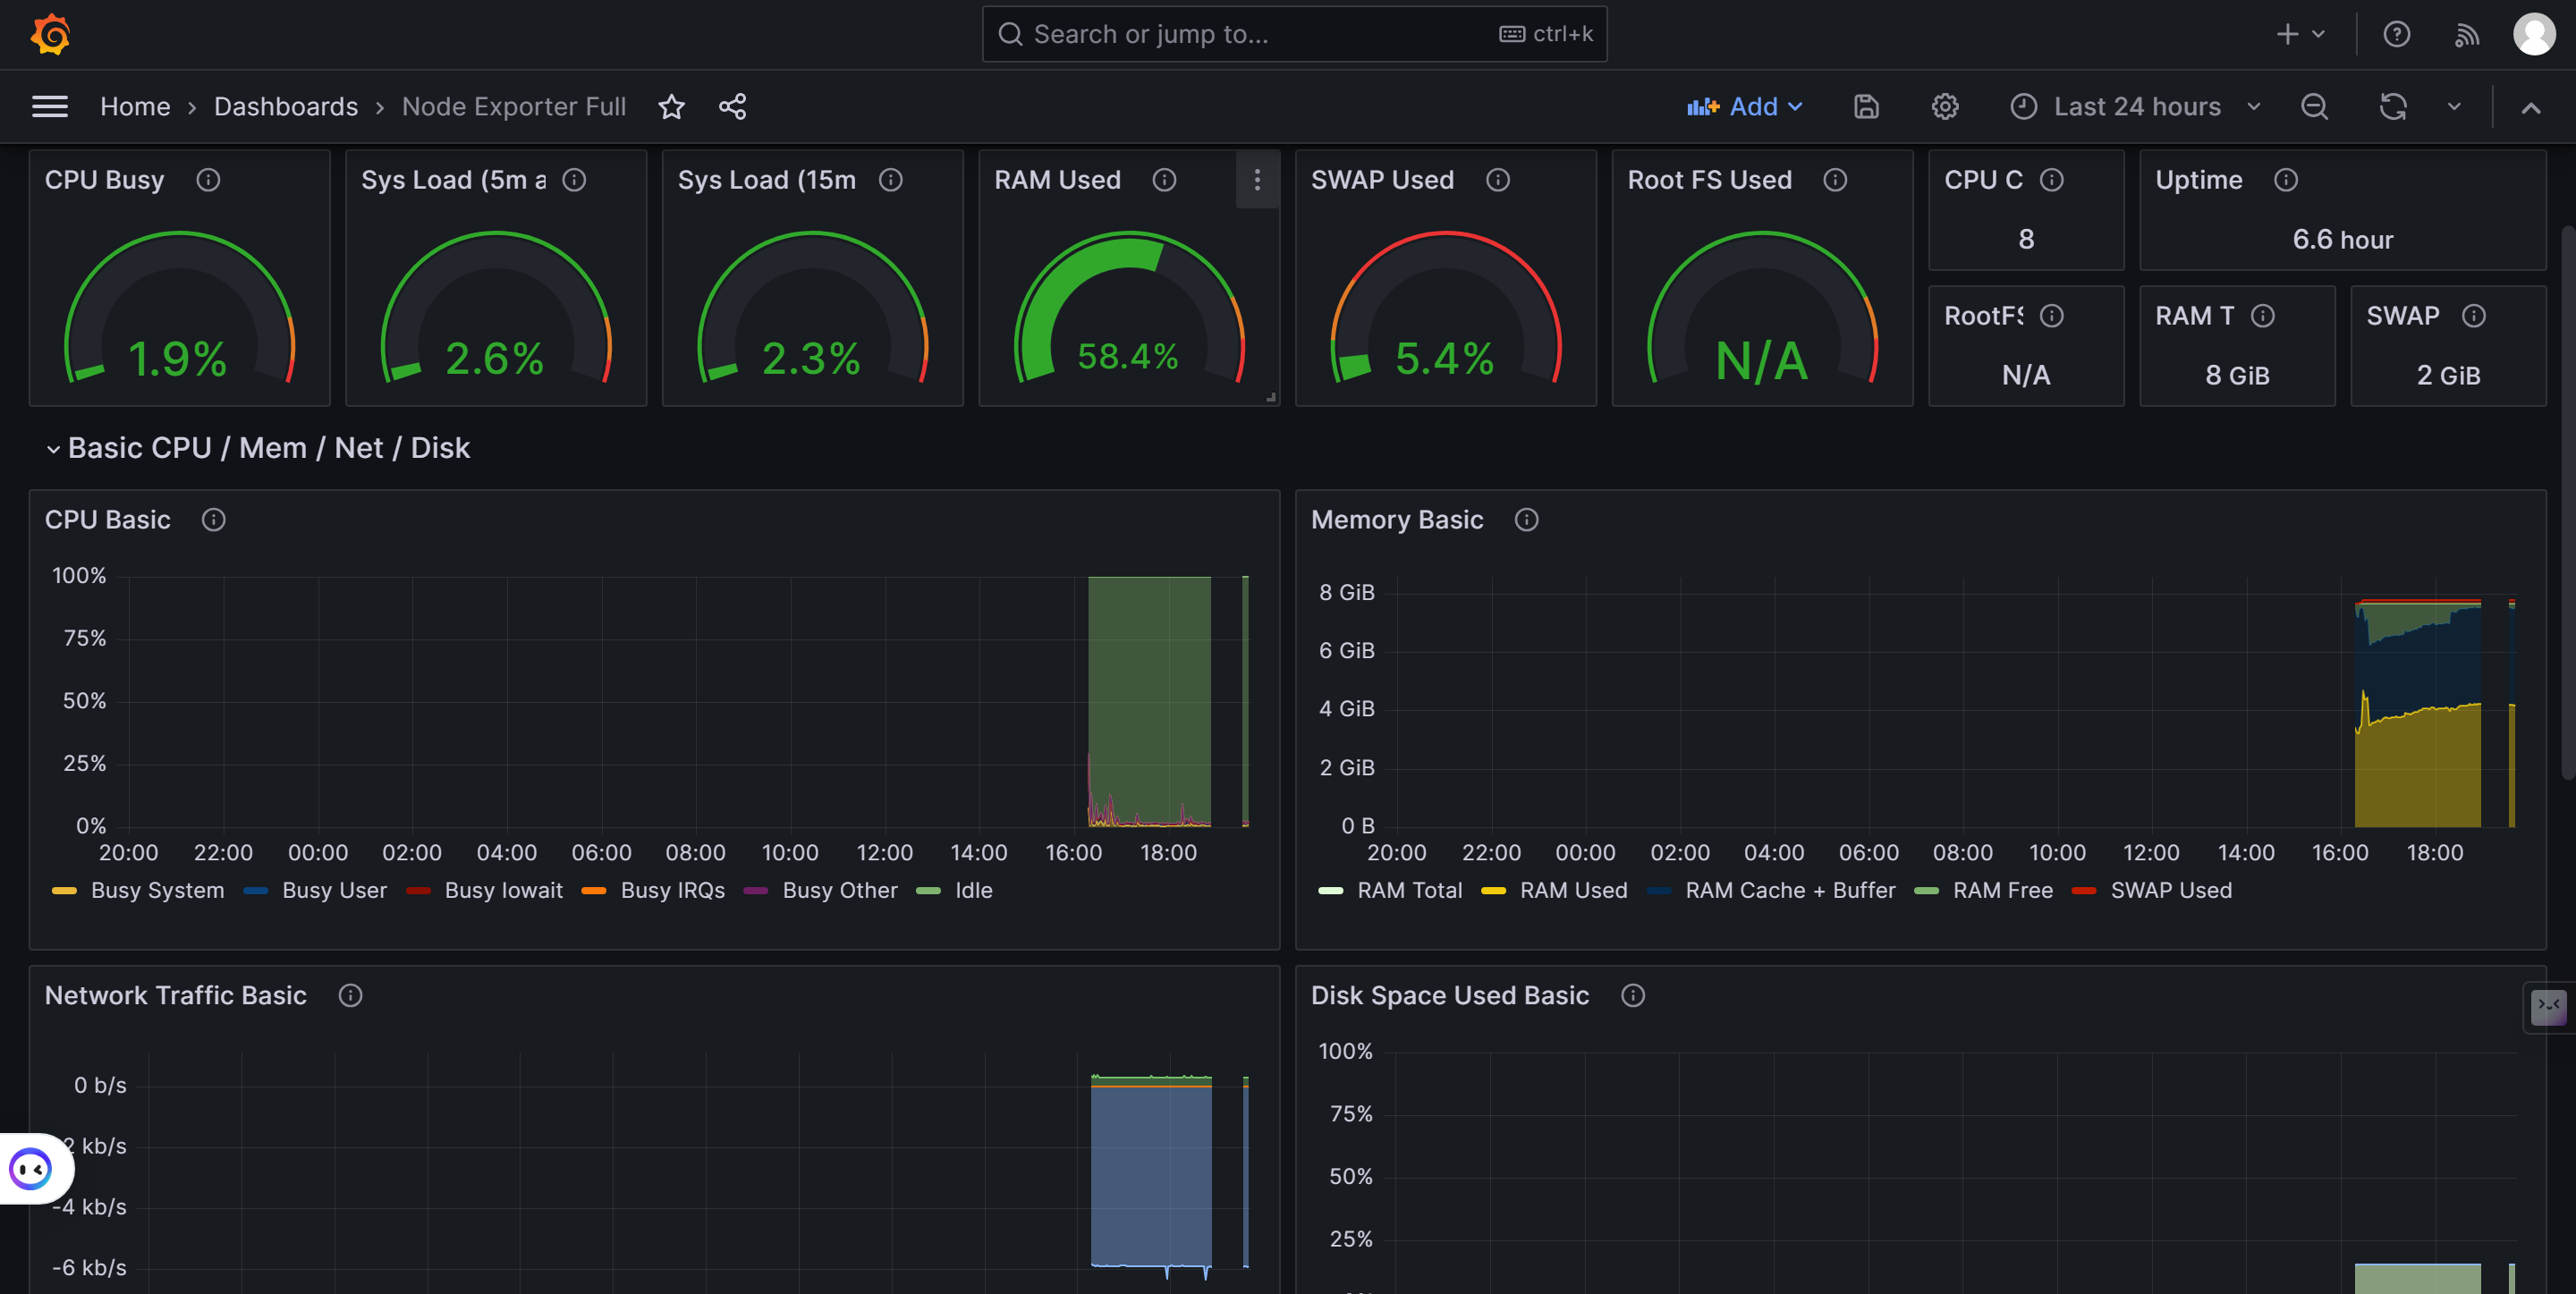
图示例:
Docker 中监控运行指南
简介
本指南提供了如何使用 Docker 运行 OpenIM 的步骤。OpenIM 是一款开源的即时通讯解决方案,可以通过 Docker 快速部署。更多信息请参考 OpenIM Docker GitHub。
前置条件
- 确保已安装 Docker 和 Docker Compose。
- 基本了解 Docker 和容器化技术。
步骤 1: 克隆仓库
首先,克隆 OpenIM Docker 仓库:
git clone https://github.com/openimsdk/openim-docker.git
进入仓库目录并查看 README 文件,以获取更多信息和配置选项。
步骤 2: 启动 Docker Compose
在仓库目录中,运行以下命令启动服务:
docker-compose up -d
这会下载所需的 Docker 镜像并启动 OpenIM 服务。
步骤 3: 使用 OpenIM Web 端
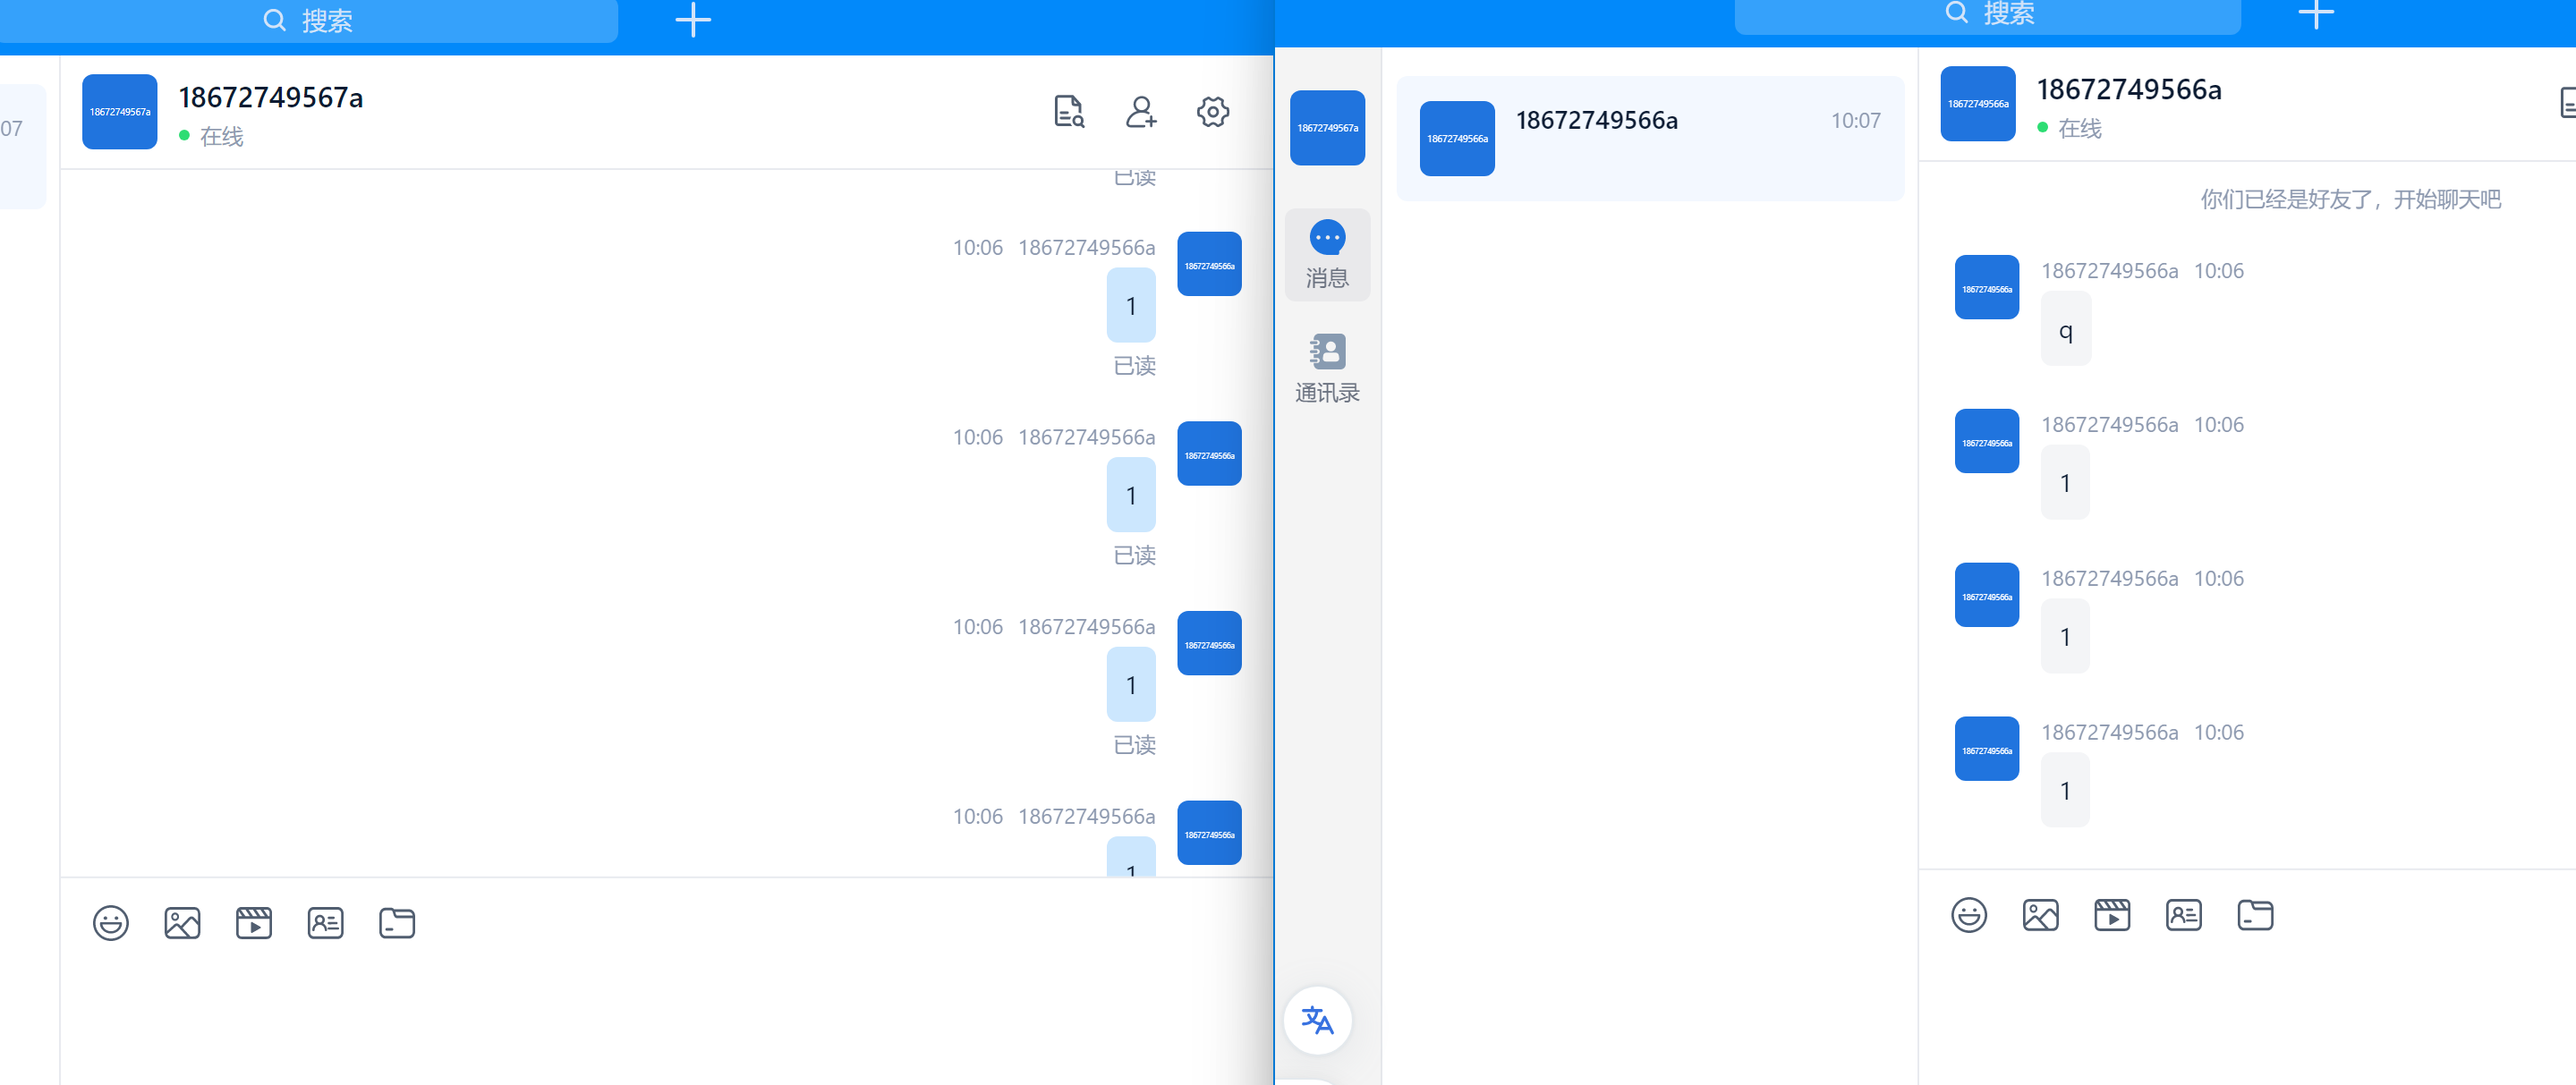
- 打开浏览器的隐私模式,访问 OpenIM Web。
- 注册两个用户,并尝试添加好友。
- 测试发送消息和图片。
运行效果
步骤 4: 访问管理后台
- 访问 OpenIM 管理后台。
- 使用默认的用户名和密码 (
admin1:admin1) 登录。
运行效果图:
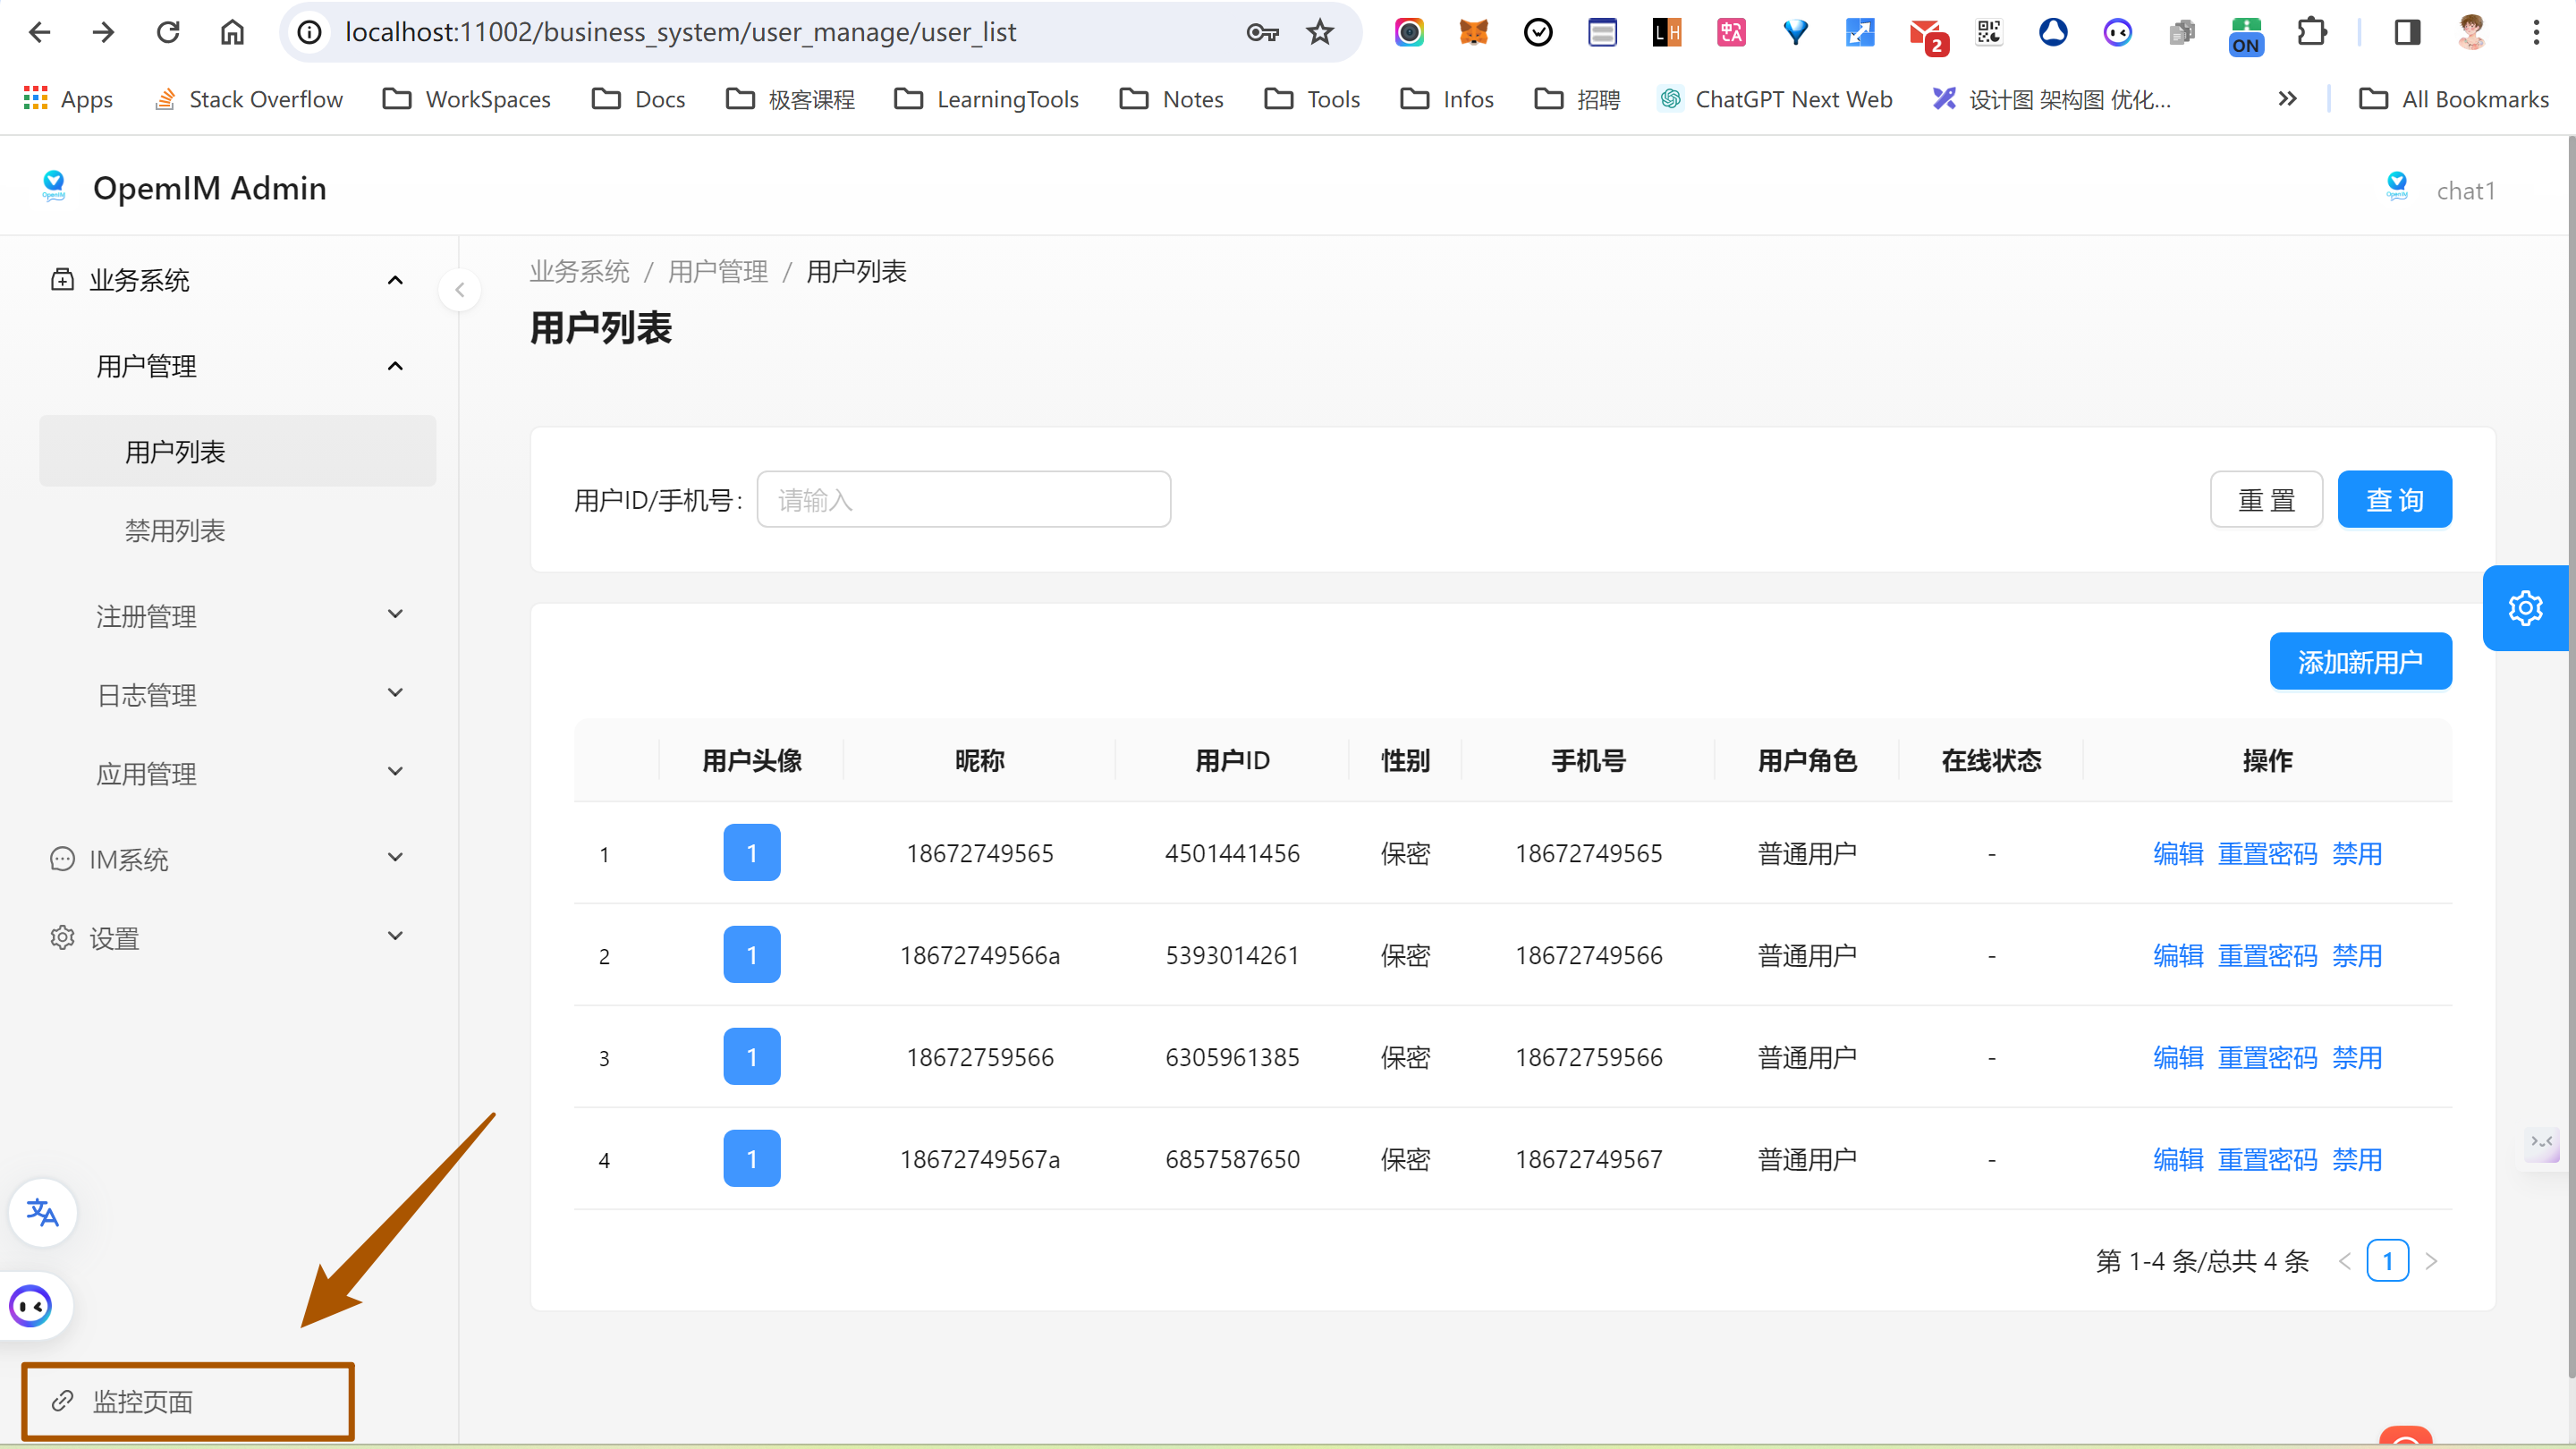
步骤 5: 进入监控界面
- 通过上续图片的 监控界面 登录。
- 使用默认的用户名和密码 (
admin:admin)。
后续步骤
- 按照 OpenIM 源码提供的步骤配置和管理服务。
- 参考
README文件进行高级配置和管理。
常见问题解决
- 如果遇到任何问题,请查阅 OpenIM Docker GitHub 上的文档,或在 Issues 部分搜索相关问题。
- 如果问题还是没有解决,那么请你提一个 issue 到 openim-docker 仓库或者是 openim-server 仓库
Kubernetes
参考 https://github.com/openimsdk/helm-charts
在 Kubernetes 环境下部署和监控 OpenIM 时,您将专注于三个主要指标:中间件、OpenIM 自定义指标,以及 Node Exporter。以下是详细的步骤和指南:
中间件监控
中间件监控是确保整个系统稳定运行的关键。通常,这包括对以下组件的监控:
- MySQL:监控数据库性能、查询延时等。
- Redis:追踪操作延时、内存使用等。
- MongoDB:观察数据库操作、资源使用等。
- Kafka:监控消息吞吐量、延时等。
- Zookeeper:关注集群状态、性能指标等。
对于 Kubernetes 环境,您可以使用相应的 Prometheus Exporters 来收集这些中间件的监控数据。
OpenIM 自定义指标
OpenIM 自定义指标为您提供了关于 OpenIM 应用本身的重要信息,例如用户活跃度、消息流量、系统性能等。要在 Kubernetes 中监控这些指标:
- 确保 OpenIM 应用配置以暴露 Prometheus 指标。
- 使用 Helm chart(参考 OpenIM Helm Charts)进行部署时,注意配置相关的监控设置。
Node Exporter
Node Exporter 用于收集 Kubernetes 节点的硬件和操作系统级别的指标,如 CPU、内存、磁盘使用情况等。在 Kubernetes 中集成 Node Exporter:
- 通过相应的 Helm chart 部署 Node Exporter。您可以在 Prometheus 社区 找到相关信息和指南。
- 确保 Node Exporter 的数据能被集群中的 Prometheus 实例采集。
Deployment and Design of OpenIM's Management Backend and Monitoring
OpenIM offers various flexible deployment options to suit different environments and requirements. Here is a simplified and optimized description of these deployment options:
- Source Code Deployment:
- Regular Source Code Deployment: Deployment using the
nohupmethod. This is a basic deployment method suitable for development and testing environments. For details, refer to the Regular Source Code Deployment Guide. - Production-Level Deployment: Deployment using the
systemmethod, more suitable for production environments. This method provides higher stability and reliability. For details, refer to the Production-Level Deployment Guide.
- Regular Source Code Deployment: Deployment using the
- Cluster Deployment:
- Kubernetes Deployment: Provides two deployment methods, including deployment through Helm and sealos. This is suitable for environments that require high availability and scalability. Specific methods can be found in the Kubernetes Deployment Guide.
- Docker Deployment:
- Regular Docker Deployment: Suitable for quick deployments and small projects. For detailed information, refer to the Docker Deployment Guide.
- Docker Compose Deployment: Provides more convenient service management and configuration, suitable for complex multi-container applications.
Next, we will introduce the specific steps, monitoring, and management backend configuration for each of these deployment methods, as well as usage tips to help you choose the most suitable deployment option according to your needs.
Source Code & Docker
Deployment
OpenIM deploys openim-server and openim-chat from source code, while other components are deployed via Docker.
For Docker deployment, you can deploy all components with a single command using the openimsdk/openim-docker repository. The deployment configuration can be found in the environment.sh document, which provides information on how to learn and familiarize yourself with various environment variables.
For Prometheus, it is not enabled by default. To enable it, set the environment variable before executing make init:
export PROMETHEUS_ENABLE=true # Default is false
Then, execute:
make init
docker compose up -d
Configuration
To configure Prometheus data sources in Grafana, follow these steps:
Log in to Grafana: First, open your web browser and access the Grafana URL. If you haven't changed the port, the address is typically http://localhost:3000.
Log in with default credentials: Grafana's default username and password are both
admin. You will be prompted to change the password on your first login.Access Data Sources Settings:
- In the left menu of Grafana, look for and click the "gear" icon representing "Configuration."
- In the configuration menu, select "Data Sources."
Add a New Data Source:
- On the Data Sources page, click the "Add data source" button.
- In the list, find and select "Prometheus."

Click
Add New connectionto add more data sources, such as Loki (responsible for log storage and query processing).Configure the Prometheus Data Source:
- On the configuration page, fill in the details of the Prometheus server. This typically includes the URL of the Prometheus service (e.g., if Prometheus is running on the same machine as OpenIM, the URL might be
http://172.28.0.1:19090, with the address matching theDOCKER_BRIDGE_GATEWAYvariable address). OpenIM and the components are linked via a gateway. The default port used by OpenIM is19090. - Adjust other settings as needed, such as authentication and TLS settings.

- On the configuration page, fill in the details of the Prometheus server. This typically includes the URL of the Prometheus service (e.g., if Prometheus is running on the same machine as OpenIM, the URL might be
Save and Test:
- After completing the configuration, click the "Save & Test" button to ensure that Grafana can successfully connect to Prometheus.
Importing Dashboards in Grafana
Importing Grafana Dashboards is a straightforward process and is applicable to OpenIM Server application services and Node Exporter. Here are detailed steps and necessary considerations:
Key Metrics Overview and Deployment Steps
To monitor OpenIM in Grafana, you need to focus on three categories of key metrics, each with its specific deployment and configuration steps:
- OpenIM Metrics (
prometheus-dashboard.yaml):- Configuration File Path: Located at
config/prometheus-dashboard.yaml. - Enabling Monitoring: Set the environment variable
export PROMETHEUS_ENABLE=trueto enable Prometheus monitoring. - More Information: Refer to the OpenIM Configuration Guide.
- Configuration File Path: Located at
- Node Exporter:
- Container Deployment: Deploy the
quay.io/prometheus/node-exportercontainer for node monitoring. - Get Dashboard: Access the Node Exporter Full Feature Dashboard and import it using YAML file download or ID import.
- Deployment Guide: Refer to the Node Exporter Deployment Documentation.
- Container Deployment: Deploy the
- Middleware Metrics: Each middleware requires specific steps and configurations to enable monitoring. Here is a list of common middleware and links to their respective setup guides:
- MySQL:
- Configuration: Ensure MySQL has performance monitoring enabled.
- Link: Refer to the MySQL Monitoring Configuration Guide.
- Redis:
- Configuration: Configure Redis to allow monitoring data export.
- Link: Refer to the Redis Monitoring Guide.
- MongoDB:
- Configuration: Set up monitoring metrics for MongoDB.
- Link: Refer to the MongoDB Monitoring Guide.
- Kafka:
- Configuration: Integrate Kafka with Prometheus monitoring.
- Link: Refer to the Kafka Monitoring Guide.
- Zookeeper:
- Configuration: Ensure Zookeeper can be monitored by Prometheus.
- Link: Refer to the Zookeeper Monitoring Configuration.
- MySQL:
Importing Steps:
Access the Dashboard Import Interface:
- Click the
+icon on the left menu or in the top right corner of Grafana, then select "Create." - Choose "Import" to access the dashboard import interface.
- Click the
Perform Dashboard Import:
- Upload via File: Directly upload your YAML file.
- Paste Content: Open the YAML file, copy its content, and paste it into the import interface.
- Import via Grafana.com Dashboard: Visit Grafana Dashboards, search for the desired dashboard, and import it using its ID.
Configure the Dashboard:
- Select the appropriate data source, such as the previously configured Prometheus.
- Adjust other settings, such as the dashboard name or folder.
Save and View the Dashboard:
- After configuring, click "Import" to complete the process.
- Immediately view the new dashboard after successful import.
Graph Examples:

Monitoring Running in Docker Guide
Introduction
This guide provides the steps to run OpenIM using Docker. OpenIM is an open-source instant messaging solution that can be quickly deployed using Docker. For more information, please refer to the OpenIM Docker GitHub.
Prerequisites
- Ensure that Docker and Docker Compose are installed.
- Basic understanding of Docker and containerization technology.
Step 1: Clone the Repository
First, clone the OpenIM Docker repository:
git clone https://github.com/openimsdk/openim-docker.git
Navigate to the repository directory and check the README file for more information and configuration options.
Step 2: Start Docker Compose
In the repository directory, run the following command to start the service:
docker-compose up -d
This will download the required Docker images and start the OpenIM service.
Step 3: Use the OpenIM Web Interface
- Open a browser in private mode and access OpenIM Web.
- Register two users and try adding friends.
- Test sending messages and pictures.
Running Effect

Step 4: Access the Admin Panel
- Access the OpenIM Admin Panel.
- Log in using the default username and password (
admin1:admin1).
Running Effect Image:

Step 5: Access the Monitoring Interface
- Log in to the Monitoring Interface using the credentials (
admin:admin).
Next Steps
- Configure and manage the services following the steps provided in the OpenIM source code.
- Refer to the
READMEfile for advanced configuration and management.
Troubleshooting
- If you encounter any issues, please check the documentation on OpenIM Docker GitHub or search for related issues in the Issues section.
- If the problem persists, you can create an issue on the openim-docker repository or the openim-server repository.
Kubernetes
Refer to openimsdk/helm-charts.
When deploying and monitoring OpenIM in a Kubernetes environment, you will focus on three main metrics: middleware, custom OpenIM metrics, and Node Exporter. Here are detailed steps and guidelines:
Middleware Monitoring
Middleware monitoring is crucial to ensure the overall system's stability. Typically, this includes monitoring the following components:
- MySQL: Monitor database performance, query latency, and more.
- Redis: Track operation latency, memory usage, and more.
- MongoDB: Observe database operations, resource usage, and more.
- Kafka: Monitor message throughput, latency, and more.
- Zookeeper: Keep an eye on cluster status, performance metrics, and more.
For Kubernetes environments, you can use the corresponding Prometheus Exporters to collect monitoring data for these middleware components.
Custom OpenIM Metrics
Custom OpenIM metrics provide essential information about the OpenIM application itself, such as user activity, message traffic, system performance, and more. To monitor these metrics in Kubernetes:
- Ensure OpenIM application configurations expose Prometheus metrics.
- When deploying using Helm charts (refer to OpenIM Helm Charts), pay attention to configuring relevant monitoring settings.
Node Exporter
Node Exporter is used to collect hardware and operating system-level metrics for Kubernetes nodes, such as CPU, memory, disk usage, and more. To integrate Node Exporter in Kubernetes:
- Deploy Node Exporter using the appropriate Helm chart. You can find information and guides on Prometheus Community.
- Ensure Node Exporter's data is collected by Prometheus instances within your cluster.
Setting Up and Configuring AlertManager Using Environment Variables and make init
Introduction
AlertManager, a component of the Prometheus monitoring system, handles alerts sent by client applications such as the Prometheus server. It takes care of deduplicating, grouping, and routing them to the correct receiver. This document outlines how to set up and configure AlertManager using environment variables and the make init command. We will focus on configuring key fields like the sender's email, SMTP settings, and SMTP authentication password.
Prerequisites
- Basic knowledge of terminal and command-line operations.
- AlertManager installed on your system.
- Access to an SMTP server for sending emails.
Configuration Steps
Exporting Environment Variables
Before initializing AlertManager, you need to set environment variables. These variables are used to configure the AlertManager settings without altering the code. Use the export command in your terminal. Here are some key variables you might set:
export ALERTMANAGER_RESOLVE_TIMEOUT='5m'export ALERTMANAGER_SMTP_FROM='alert@example.com'export ALERTMANAGER_SMTP_SMARTHOST='smtp.example.com:465'export ALERTMANAGER_SMTP_AUTH_USERNAME='alert@example.com'export ALERTMANAGER_SMTP_AUTH_PASSWORD='your_password'export ALERTMANAGER_SMTP_REQUIRE_TLS='false'
Initializing AlertManager
After setting the necessary environment variables, you can initialize AlertManager by running the make init command. This command typically runs a script that prepares AlertManager with the provided configuration.
Key Configuration Fields
a. Sender's Email (ALERTMANAGER_SMTP_FROM)
This variable sets the email address that will appear as the sender in the notifications sent by AlertManager.
b. SMTP Configuration
- SMTP Server (
ALERTMANAGER_SMTP_SMARTHOST): Specifies the address and port of the SMTP server used for sending emails. - SMTP Authentication Username (
ALERTMANAGER_SMTP_AUTH_USERNAME): The username for authenticating with the SMTP server. - SMTP Authentication Password (
ALERTMANAGER_SMTP_AUTH_PASSWORD): The password for SMTP server authentication. It's crucial to keep this value secure.
Configuring SMTP Authentication Password
The SMTP authentication password can be set using the ALERTMANAGER_SMTP_AUTH_PASSWORD environment variable. It's recommended to use a secure method to set this variable to avoid exposing sensitive information. For instance, you might read the password from a secure file or a secret management tool.
Useful Links for Common Email Servers
For specific configurations related to common email servers, you may refer to their respective documentation:
- Gmail SMTP Settings:
- Microsoft Outlook SMTP Settings:
- Yahoo Mail SMTP Settings:
Conclusion
Setting up and configuring AlertManager with environment variables provides a flexible and secure way to manage alert settings. By following the above steps, you can easily configure AlertManager for your monitoring needs. Always ensure to secure sensitive information, especially when dealing with SMTP authentication credentials.